Footing
Navigational state-space charts for human domains: where you are, where you want to be, and the measured moves that get you there.
TL;DR
- Route planner: compositions of up to three measured moves, drawn on the field with waypoints.
- Effect estimation with fractional attribution, baseline correction, recency weighting and shrinkage — sample counts and uncertainty cones shown, never hidden.
- Chartability self-grade against the five criteria; the kill criterion is built into the product.
- Local-first by construction: IndexedDB, OPFS backups, PIN lock, no backend or analytics.
- Zero runtime dependencies; the engine is pure TypeScript under a Vitest suite.
Try it
This is the real build. It opens full-screen with a way back to this page, stores everything in your own browser and talks to nothing — close the tab and it is gone.
Screens
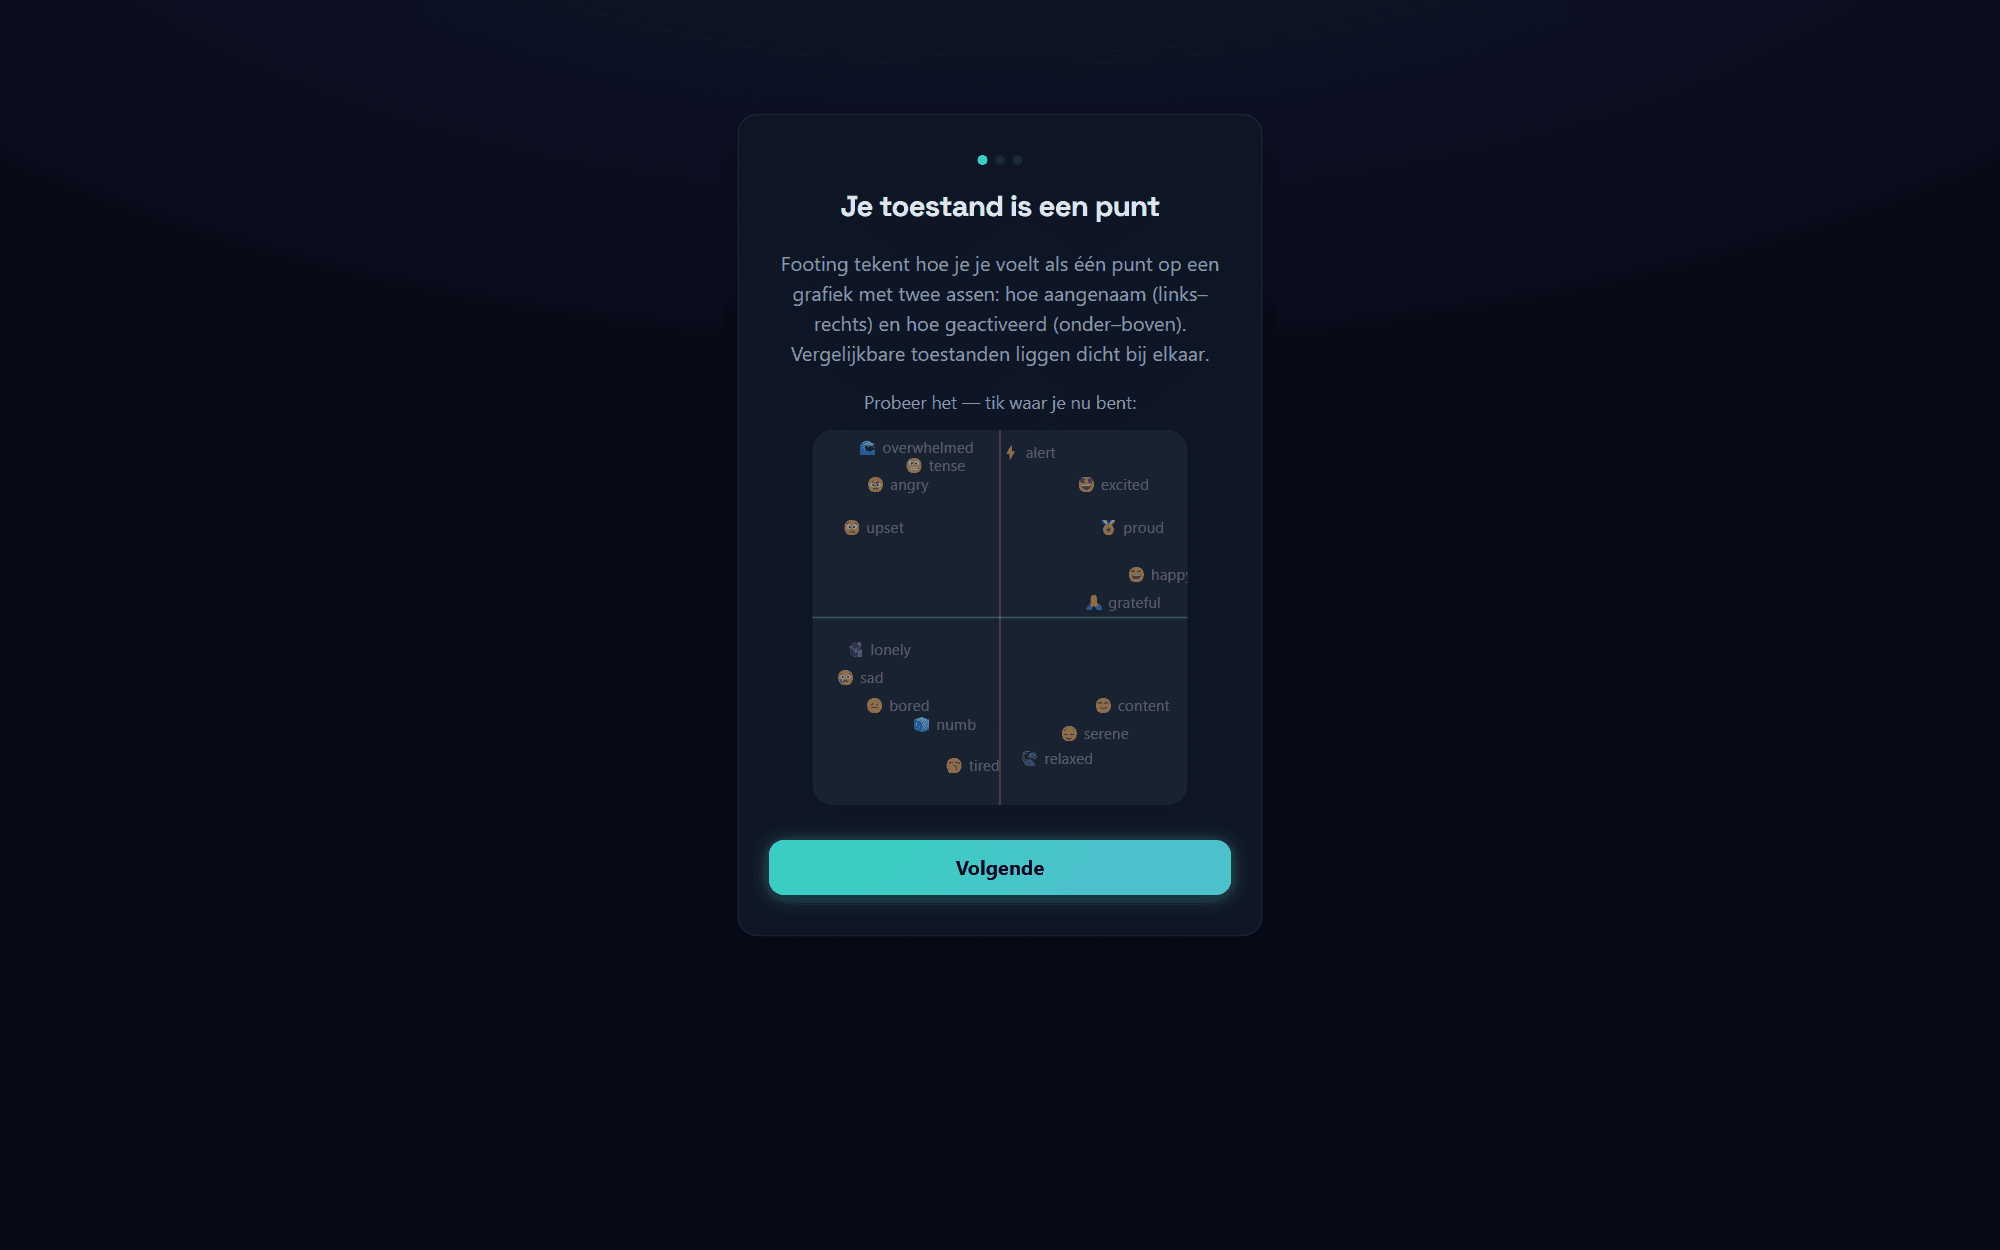
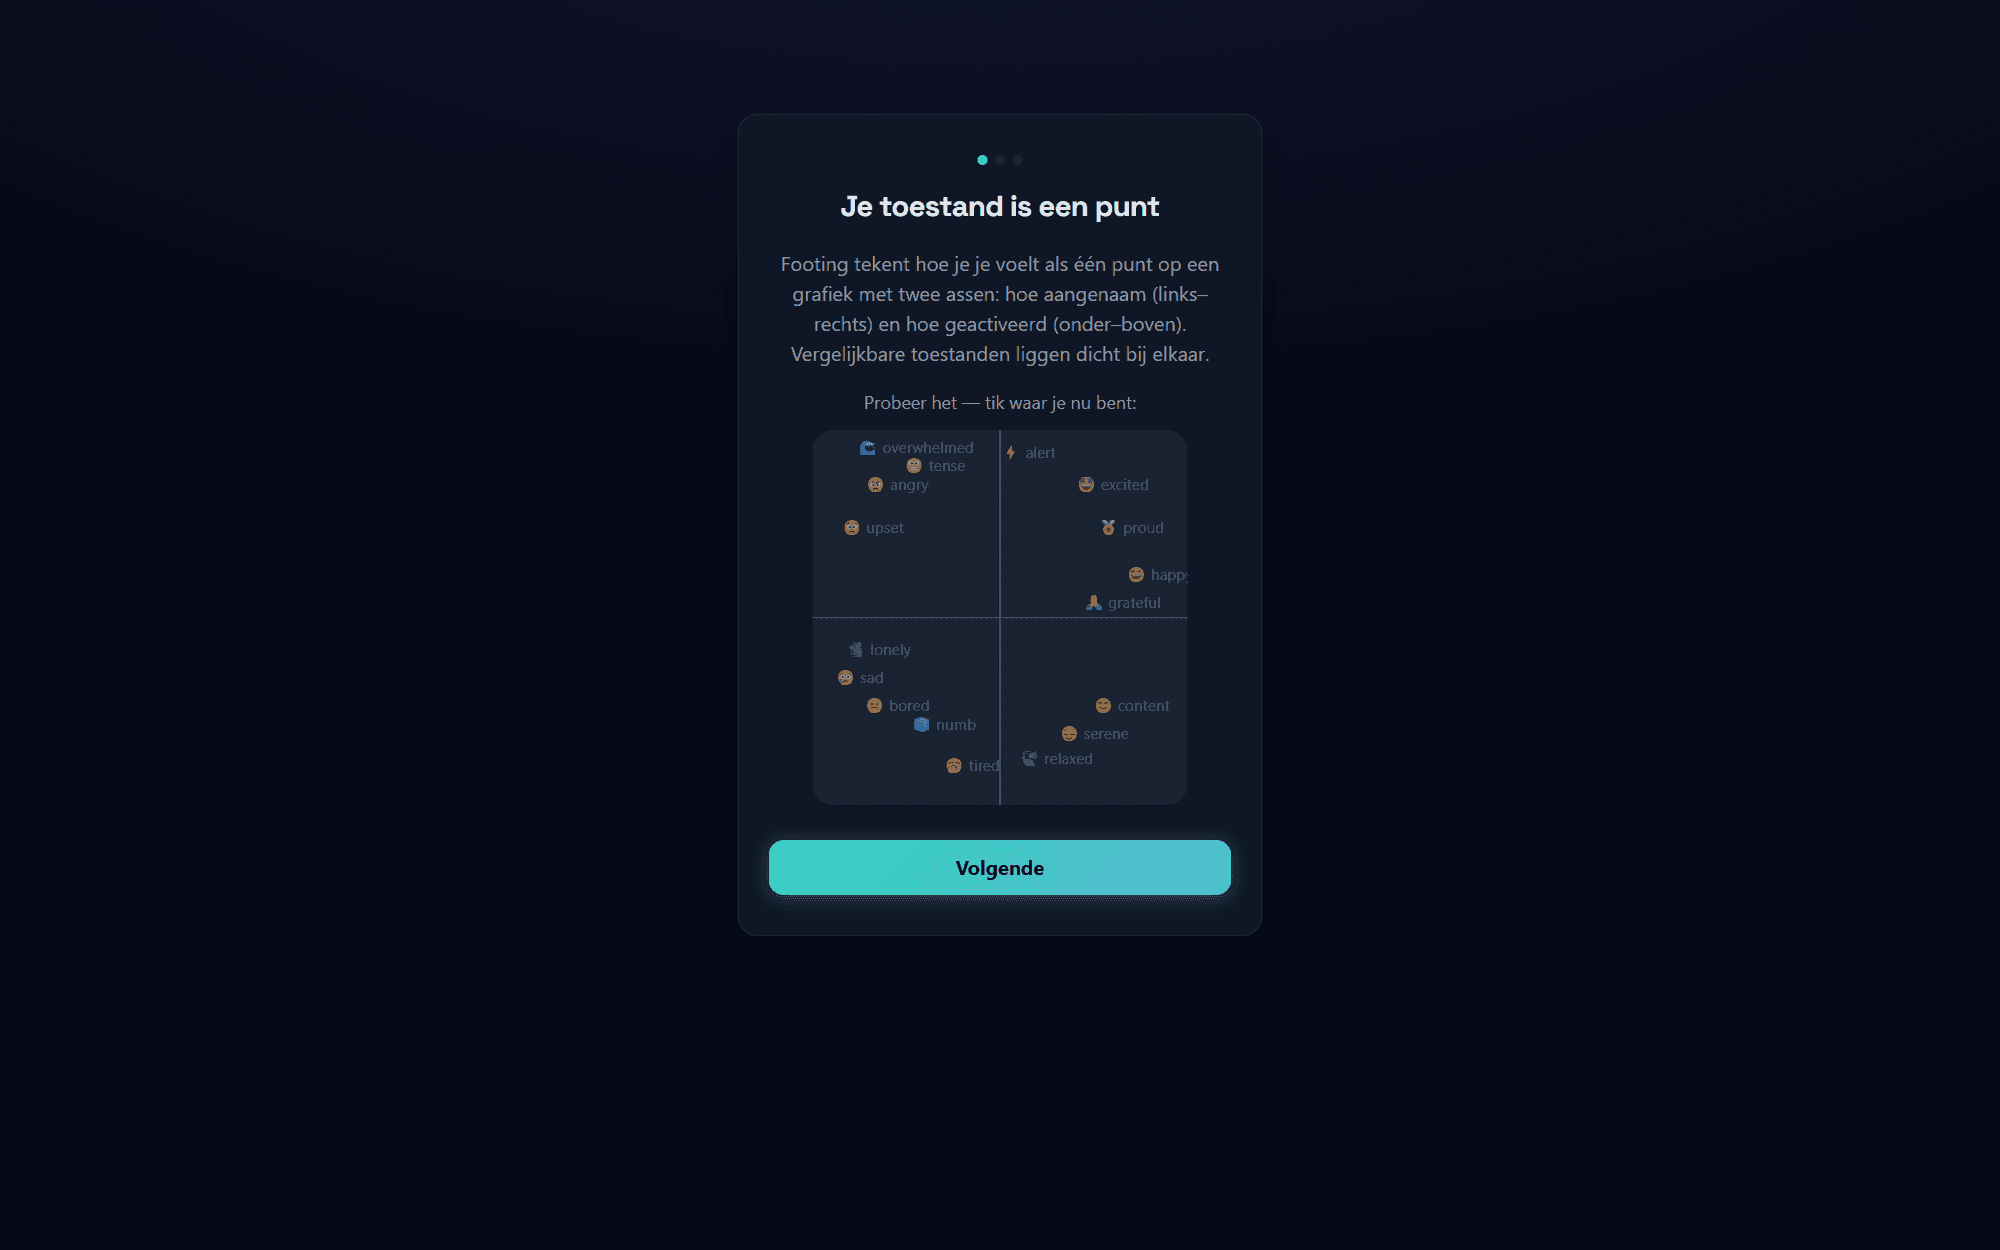
The premise, in one screen
Onboarding does not explain features, it explains the model: your state is a single point on two axes — how pleasant, left to right, and how activated, bottom to top. Landmarks like tense, content and tired sit where they belong so the grid reads before you have any data on it.
Honest by design
The third onboarding slide is the product thesis: a self-observation tool, not therapy; data that never leaves the device; and the promise that when an operation turns out unreliable the app says so instead of pretending. Setting the target region is the last thing it asks before letting you in.
The field, with a route home
Current state as a point, the target region as a dashed circle, and operations ranked by how much each is expected to close the distance — cyclic sighing marked as the best move from here. The badge under the grid reads “home in 3 moves”: the reachability claim the whole project is built to earn.
Problem
Mood trackers draw you a pretty chart and stop there. You can see where you are; you cannot see what moves you. The founding research behind this project argues a chart only becomes a navigation instrument when its operations are measured motions that compose into reachable orbits — and almost no self-tracking app clears that bar. Without it you have a picture, not a route.
Approach
Check in on a valence × arousal grid (Russell's circumplex), then log operations — walks, cyclic sighing, whatever you actually do — each seeded with a literature-informed prior vector. Pre/post check-ins are paired into observed displacements: fractionally attributed when operations overlap, corrected for your own time-of-day baseline, recency-weighted on a 30-day half-life, and shrunk toward the prior until the evidence earns its own weight. A route planner then searches compositions of up to three measured moves and draws the one that lands you home. Everything is local-first: IndexedDB on the device, OPFS auto-backups, JSON/CSV export, optional PIN lock. No backend, no accounts, no analytics.
Outcome
Beta, shipped as a zero-runtime-dependency Vite PWA. Charts are data, so new domains (Mood, Flow) are definitions rather than code. The part worth arguing about is the self-grade: Footing scores its own live chart against all five chartability criteria using your data and states plainly whether it currently is a chart or merely a map. Operations with inconsistent evidence get flagged “map, not route”. The app never claims navigational power it has not earned.
Related